Visually.Me

Visually.Me

AboutBlog

Blog


LAST MONTH · 2 MIN READ

Scenario Comparison

Will Yip

Will Yip

calculator
projection
scenario

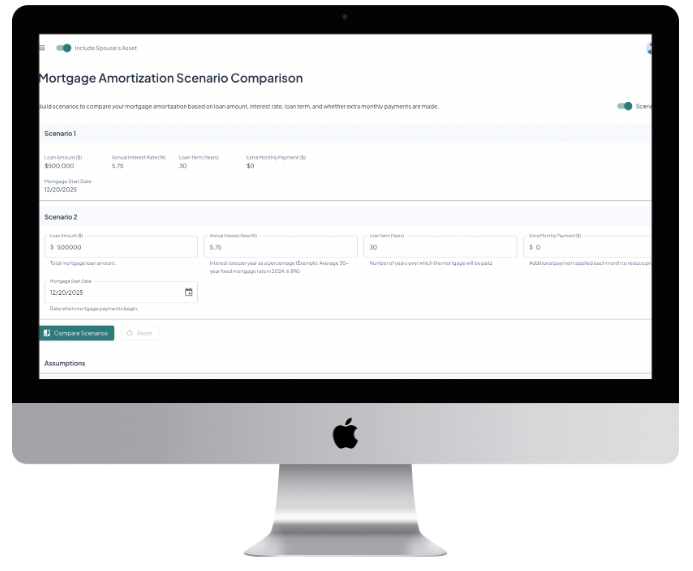
We’re excited to announce a powerful new feature across all of our financial calculators: Scenario Comparison. Whether you’re planning for retirement, funding college, or managing mortgages, you can now easily compare multiple “what-if” scenarios and make more informed decisions for your financial future.

Compare Scenarios Across All Calculators

With Scenario Comparison, you can run multiple scenarios in parallel and instantly see the differences. This feature is available in all of our existing calculators:

  • College Savings / Tuition Calculator – Compare different savings rates, tuition inflation assumptions, or contribution timelines to see how they affect your ability to meet future college costs.

  • FERS or Uniformed Service Pension Calculator – Evaluate different retirement ages, service years, or benefit assumptions to understand the impact on your lifetime pension income.

  • Mortgage Amortization Calculator – Test different extra payments, interest rates, or loan terms to see how they affect monthly payments and total interest over the life of your mortgage.

  • Retirement Savings Calculator – Explore multiple contribution strategies, investment returns, and retirement ages to see how your nest egg could grow under different scenarios.

  • Social Security Benefits Calculator – Compare different claiming ages and strategies to see the effect on your lifetime benefits.

How It Works

  • Create Scenarios: Simply set up a scenario with your assumptions, just like you normally would.

  • Add a Comparison: Use the Copy Scenario” button to create a second set of inputs.

  • View Differences: Our calculators automatically show side-by-side comparisons for each scenario, including a difference column for key metrics. This makes it easy to identify which choices have the biggest financial impact.

For example, in the Retirement Savings Calculator, you can see how contributing $1000/year versus $1500/year changes your total savings, projected income, and withdrawals over time. In the Mortgage Calculator, you can quickly see how a slightly lower interest rate could save thousands of dollars over the life of your loan.

Why You’ll Love It

  • Better Decision-Making: Understand the financial consequences of different choices before you commit.

  • Save Time: No need to manually recalculate or compare scenarios on paper.

  • All-in-One View: Compare scenarios in the same interface across multiple calculators.

  • Visual Insights: Charts and tables make differences clear at a glance.

Scenario Comparison empowers you to explore your options, identify trade-offs, and confidently plan for the future. Whether it’s saving for college, optimizing your retirement, or managing a mortgage, you now have a tool that shows the impact of your decisions side by side.

Ready to compare your financial scenarios? Try it today in all of our calculators and see how small changes today can make a big difference tomorrow.

Scenario Form Scenario Result


LAST MONTH · 1 MIN READ

Real Estate Card

Will Yip

Will Yip

real estate

We’re excited to introduce the updated Real Estate Card, with new information that makes it easy to see the financial performance of your properties—right on your dashboard.

With the Real Estate Card, you can quickly view:

  • Monthly Income: Total rental income generated by the property.

  • Monthly Expenses: Mortgage, property tax, insurance, HOA fees, and other recurring costs.

  • Net Cash Flow: The difference between income and expenses, highlighted for quick insights.

Each card displays the property’s label, address, and type, and provides a link to view full details for deeper analysis. Positive net cash flow is clearly marked, helping you identify which properties are performing well at a glance.

This feature streamlines property management by giving you a clear, real-time snapshot of each property’s financial health, so you can make informed decisions quickly.

Real Estate Card


DECEMBER 14, 2025 · 1 MIN READ

Timeline View

Will Yip

Will Yip

timeline
retirement

The Timeline View is another step towards fulfilling the original mission of Visually.Me. As a person looking forward to retirement, one would often ask: When does everything happen? This is exactly the reason why the Timeline view is a highly-sought feature. The Timeline View, embedded on your dashboard, is a visual, chronological representation of your financial life. It shows key milestones such as when you start drawing from retirement savings, when pensions begin, or when Social Security kicks in. They are plotted against the years that matter most to you. Instead of scanning rows of numbers, you can immediately see how your income sources unfold over time.

More is yet to come! So far, we have incorporated all of your important milestones with respect to your retirement income and investment in the Timeline view. Up next is your anticipated mortgage payoff milestone.

Timeline


DECEMBER 11, 2025 · 1 MIN READ

Real Estate Property

Will Yip

Will Yip

timeline
real estate

Real estate can be one of the most powerful—and complex—parts of your financial picture. Rental income, mortgages, taxes, insurance, maintenance, and long-term appreciation all play a role, and it’s easy for the details to become fragmented across spreadsheets and apps.

Visually.Me brings everything together in one clear, visual experience.

Visually.Me lets you manage each real estate property as a first-class part of your financial plan.

For every property, you can track:

  • Rental income
  • Mortgage payments
  • Property taxes
  • Insurance
  • Key milestones, such as payoff year

Visually.Me projects property income and expenses over time, helping you see:

  • When a property is cash-flow positive
  • How rising expenses affect long-term returns
  • What happens after a mortgage is paid off
  • How rental income contributes to retirement cash flow

Instead of guessing, you can see how the income and expense of a property evolves year by year. Try it out today: Real Estate Properties

Real Estate Cash Flow Income and Expense


DECEMBER 8, 2025 · 1 MIN READ

Uniformed Service Pension Calculation

Will Yip

Will Yip

pension
uniformed service
military
dod

We’re excited to introduce a brand-new feature that brings Uniformed Service Pension calculator to the platform! Whether you’re simply curious about your estimated military pension or looking to integrate it into your long-term retirement planning, this update makes it effortless.

This first release supports the two most common military retirement systems:

  • High-36 (High-3)
  • Blended Retirement System (BRS)

These plans are fully integrated into our calculation engine, offering simple, day-to-day estimates for casual users, as well as the ability for authenticated users to add uniformed service pension as an income source directly into their personalized dashboards.

This is just the beginning—future releases will expand support for more pension types and customization options. Stay tuned for continued enhancements!

Military Pension


DECEMBER 5, 2025 · 1 MIN READ

Overriding Projection Data

Will Yip

Will Yip

calculator
projection

We have again reached another milestone towards the vision that I have set for Visually.Me - the ability to edit your projection income and investment data. Users can directly adjust key inputs such as annual salary growth rate, annual yield percentage, and 401k contribution amount, allowing them to tailor the platform’s forecasts to match their personal reality. Instead of relying solely on broad assumptions, you now have full control to fine-tune the numbers that drive your long-term outlook. This means projections can reflect unique situations like career changes, variable income, or shifts in financial strategy, giving you a far more personalized and trustworthy view of your financial future. The saying goes: The path of life is rarely linear.

These overrides also unlock more precise investment projections. Users can now enter their own expected returns, inflation expectations, and contribution patterns to produce charts and tables that align closely with their real-world plans. Whether you are modeling an upcoming promotion, accounting for a break in employment, or comparing different portfolio strategies, you can instantly see how those choices impact your retirement trajectory. Need to remove a scenario? You can easily undo your entries by reverting the user-specified values back to the default assumptions. With this new capability, Visually.Me becomes an even more powerful tool—one that adapts to your life, your assumptions, and your goals, delivering a realistic and actionable financial outlook.

Overriding Projection Data


NOVEMBER 26, 2025 · 1 MIN READ

Dashboard

Will Yip

Will Yip

dashboard
income
projection
social security
retirement
pension

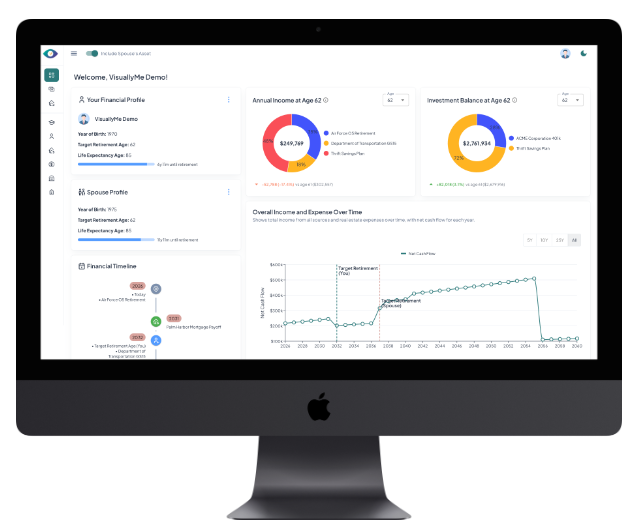
Today marks the largest and most significant update to Visually.Me since its initial debut. With this release, Visually.Me evolves from a simple calculation tool into a personalized retirement planning companion.

For the first time, users can create an account, log in, and securely save all of their income sources in one place. Whether you have a retirement savings, social security, or pension, Visually.Me now brings everything together to forecast your long-term retirement outlook.

A brand-new dashboard provides a clear, intuitive snapshot of your financial future. You’ll see your projected annual income at your target retirement age, how it compares to the previous year, and the estimated value of your retirement investment accounts like 401(k)s or TSP. These views are designed to help you understand your readiness at a glance—without needing spreadsheets or complex calculators.

You can add as many income sources as you’d like, and Visually.Me adapts in real time. The more information you enter, the more complete and accurate your projection becomes, giving you confidence in the road ahead.

At this stage, pension calculations are available only for Federal employees, but expanding support to other pension systems is already on the roadmap. This is just the beginning—many powerful features are in development to help make retirement planning simple, visual, and accessible for everyone.

Dashboard Income


NOVEMBER 14, 2025 · 1 MIN READ

Encryption at Rest

Will Yip

Will Yip

security
encryption

At Visually.Me, your privacy is our top priority. We understand that your personal data, like year of birth and retirement goals, is sensitive. That’s why we use robust, application-level encryption to keep your information secure.

Every piece of data is protected using strong cryptographic keys that are carefully managed at the application level. We employ key rotation practices to ensure your data stays secure over time, without impacting your experience. Encryption is applied seamlessly, so your access to features remains smooth and intuitive. Only you can decrypt your personal information, keeping it safe from unauthorized access. Our security practices follow industry best standards to protect against potential threats.

With Visually.Me, safeguarding your sensitive information is built into every feature. Enjoy the full benefits of our platform knowing your privacy and data security are always a top priority.


AUGUST 30, 2025 · 1 MIN READ

Why is it called Visually.Me?

Will Yip

Will Yip

finance
calculator

You may ask - what is in the name Visually Me? The name stems from the fact that I wanted to build something that is visually pleasing, to visualize our own financial future. I know that there is a plethora of financial calculators out there like calculator.net. Most are fairly basic in terms of the number of inputs / variables that you can specify. Most do not provide projection into the future on a year-by-year basis (e.g. 30 years into your retirement). A lot of these calculators are one-and-done - you perform a calculation for a very specific need and you don't come back until you have another need. I wanted to build something that is persistent - something that will track your financial goals towards ultimate retirement. Our customizable tables and charts allow you to tailor the projection, build scenarios with simple-to-use input forms. No longer do you need to play guessing game on how much your incomes and expenses will be in 30 years.

Name


AUGUST 28, 2025 · 2 MIN READ

Birth of Visually.Me

Will Yip

Will Yip

retirement
calculator
projection

Welcome to Visually.Me! An app that I wanted to build for my wife and I to take control of our own financial future. Like most typical people, I started off doing our financial and retirement planning from a spreadsheet. Start with a balance, and calculate how much I have been earning from my various investment accounts, etc. I then moved onto doing something a little bit more advanced - using formulas and charts to project my future earnings and income based on a set of assumptions that can be customized as variables. This got me thinking - how can I share that "template" with my friends and colleagues. Obviously I am not going to share my own financial situation with them but I want to share how I am projecting my various income sources down the road. I don't want the hassle of having to remove all of the data when I make improvements to the template with newer capabilities.

With that idea, an MVP (Minimally Viable Product) was born. I made a Linked Post to gauge interests from my friends and colleagues. My initial focus was to build out finacial calculators that are commonly used by most professionals, but with the caveat that the Pension Calculator is based on FERS (Federal Employee Retirement System). It was a timely move since it was built at a time where the current administration was incentivizing early retirements for employees who have been with the federal government for 20+ years.

So far, the calculators that I have built are:

  • Retirement Savings
  • FERS Pension
  • Social Security Benefits
  • College Savings and Tuition
  • Mortgage Amortization

Birth

Disclaimer: The financial calculators and content on this website are for informational and educational purposes only. They are not intended as financial, tax, or investment advice. All results are estimates based on the data you provide and assumptions made by the model. Actual outcomes may vary significantly. Please consult a licensed financial advisor before making any financial decisions.Privacy Policy|Terms of Use